

The global supply chain is currently a minefield of shifting loyalties and systemic insecurity. If you feel like the goalposts for procurement and compliance move every time you find your footing, you aren’t alone. Between geopolitical friction and tightening transparency mandates, the “fly in the ointment” for many Small and Medium Enterprises (SMEs) is no longer just carbon—it is proving your human capital resilience through diversity equity and inclusion.
Large-cap buyers and investors have moved past “checking a box.” They are now asking for defensible data. For the SME, this means shifting from vague statements about an inclusive environment to providing a concrete inclusion index that stands up to an audit.
Key Takeaways
Quantifiable Trust: An index transforms subjective inclusion efforts into benchmarkable scores for procurement.
SME-Specific Logic: Effective frameworks prioritize high-impact inclusion metrics without the data burden of a multinational corporation.
Strategic Alignment: Integrating DEIB into people development directly improves relative performance in competitive tenders.
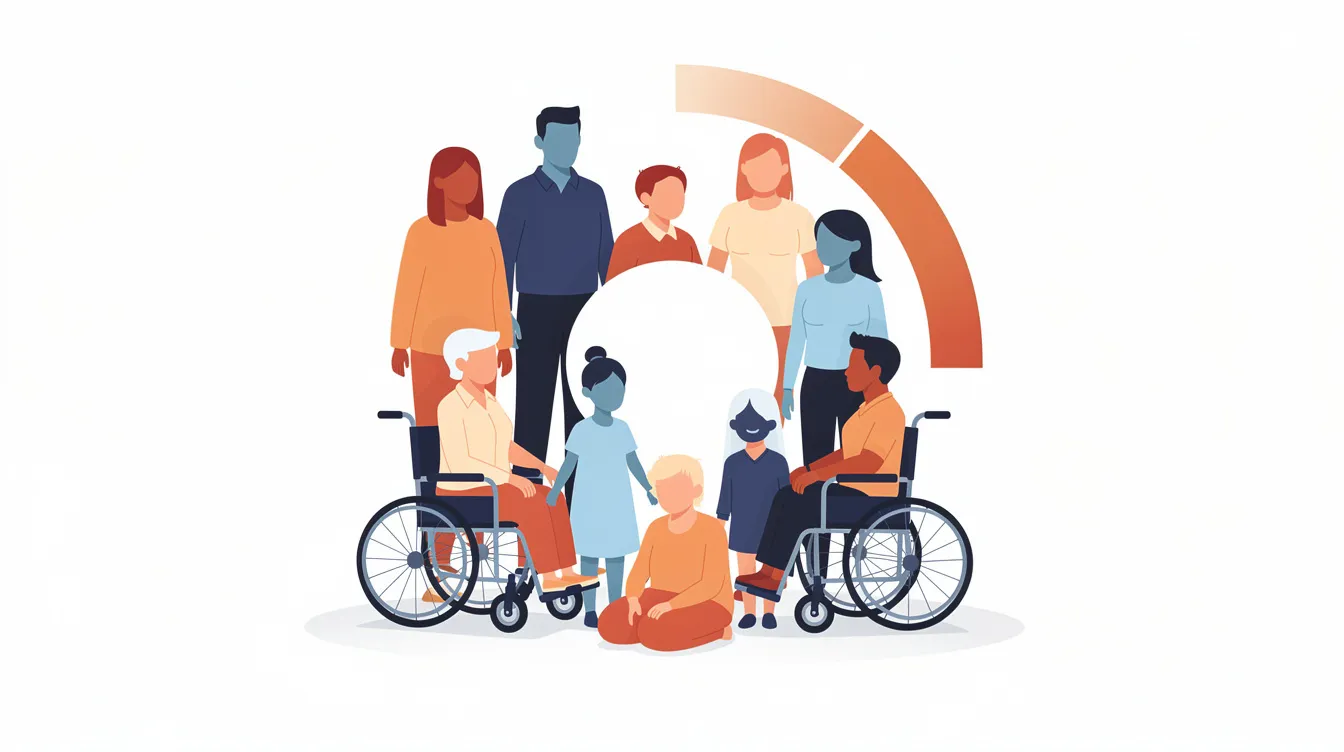
The Inclusion Index: Beyond the Headcount
A diversity and inclusion index is a composite measure. It doesn’t just look at who you hired; it looks at how they experience your workplace. For SMEs, this index reveals structural gaps that could disqualify you from major contract awards or investor due diligence.
Recent shifts in market conditions show that investors now view a diverse workforce as a proxy for innovation and risk mitigation. By regularly assessing your standing, you move from reactive posturing to inclusive growth.
Core Pillars of the SME Index
Pillar | Focus Area | Key Data Inputs |
|---|---|---|
Workforce Diversity | Representation | Headcount by gender, ethnicity, disability status, and age. |
Inclusive Workplace | Sentiment | Inclusion-survey scores and eNPS (Employee Net Promoter Score). |
People Development | Equity | Promotion rates and training access for underrepresented groups. |
Governance | Accountability | Leadership diversity and published diversity equity and inclusion policies. |
Inclusion Metrics and Methodology
To measure progress effectively, you need a methodology that accounts for smaller sample sizes. Research shows that for SMEs, weighting leadership representation and promotion parity provides the strongest signal of long-term equity.
Metrics for Diverse and Inclusive Workplaces
Candidate Funnel Diversity: Tracking conversion rates to identify gaps where unconscious bias might be stalling diverse talent.
Pay Equity: Calculating the adjusted median pay gap to ensure equity across different groups.
Retention Parity: Comparing voluntary turnover rates between underrepresented groups and the company average.
Using the Index for ESG Readiness
The inclusion index is your primary tool for ESG reporting aligned with broader ESG framework requirements. Global frameworks like the CSRD (Corporate Sustainability Reporting Directive) and ISSB standards increasingly require data on the “S” (Social) in ESG.
Why Procurement Teams Demand an Index:
Supplier Screening: Shortlists often require a minimum inclusion threshold.
Audit Preparation: Map index outputs directly to vendor risk assessments and ESG questionnaires.
Contractual KPIs: Buyers are increasingly tying performance bonuses to measurable goals in supplier sustainability.
Improving DEIB Efforts: Evidence-Based Interventions
Simply tracking data isn’t enough; you must track progress. Industry Perspectives and ESG research on workforce practices suggest that the most successful businesses focus on people development rather than just hiring quotas.
“True inclusion isn’t about the optics of the boardroom; it’s about whether a junior employee from an underrepresented background sees a clear, unobstructed path to that boardroom.” — Global Sustainability Consultant
5 Steps to Promote Diversity in Your Workplace
Structured Interviews: Remove “culture fit” ambiguity to reduce unconscious bias.
Targeted Mentoring: Link underrepresented groups with senior leadership to improve promotion parity.
ERG Support: Empower Employee Resource Groups (ERGs) for veteran status, sexual orientation, and disability status.
Inclusive Hiring: Diversify your sourcing channels to access a wider pool of diverse talent.
Manager Training: Focus on inclusive behaviors that correlate with higher team performance.
The Strategic “Why”: Linking Inclusion to Risk and Alpha
For the modern investor, a diversity and inclusion index is no longer a “feel-good” metric—it is a sophisticated tool for risk identification. Homogeneous leadership teams are prone to “groupthink,” a documented cognitive bias that creates blind spots in global market conditions. By leveraging an index, buyers can identify which businesses in their supply chain possess the cognitive diversity required to navigate rapid disruption.
The Resilience Factor
Research shows that diverse and inclusive workplaces report higher employee retention rates. In a tightening labor market, high turnover among underrepresented groups is a leading indicator of cultural rot and impending operational costs. An SME that can demonstrate relative performance above its sector average on the inclusion index signals to investors that its human capital is stable, engaged, and shielded from the high costs of churn.
Materiality and the Value Chain
When we analyze equity and inclusion dei through the lens of double materiality, we see that inclusion impacts both the company’s bottom line and its social footprint. For an SME, this means that your inclusion efforts are a material asset. Proving inclusive growth through measurable goals makes your firm a “lower-risk” partner for multinational corporations who are under pressure to report on their own value chain transparency.
Index Construction for SMEs: Navigating Data Gaps
Constructing a diversity and inclusion index as an SME requires a pragmatic approach to data. You likely don’t have the “Big Data” of a Fortune 500, but you have the advantage of agility. The total number of data points is less important than the quality and frequency of regularly assessing them.
Addressing Small-Sample Variability
One of the primary challenges for SMEs is “small-sample bias.” In a firm of 50 people, a single resignation can swing a gender representation metric by 2%. To counter this, your index should focus on time-series reporting—looking at 3-year trends rather than single-year snapshots. This demonstrates a consistent organization’s commitment rather than a statistical fluke.
5 Essential Tools for Your DEIB Toolkit
Anonymized Survey Platforms: Use tools that guarantee privacy to ensure honest feedback on the inclusive environment.
Pay Equity Spreadsheets: Simple templates to calculate the adjusted median pay gap across different groups.
Supplier Questionnaires: Standardized forms to assess the diversity of your own vendors.
Inclusion Scorecards: A visual dashboard to track progress and share results with leadership.
Exit Interview Frameworks: Specific questions to identify gaps in retention for diverse talent.
Intersectionality: The Final Frontier
While basic inclusion metrics often focus on single axes—like gender or disability status—the most advanced deib efforts account for intersectionality. This means recognizing that the experience of a veteran who also belongs to an ethnic minority group may differ from their peers. While difficult to quantify in a small headcount, qualitative feedback in your index can bridge these data gaps.
Note on Vendor Risk: As you build your index, remember that vendor risk now includes social compliance. If your supply chain lacks inclusion, that risk eventually travels up to you. Integrating supplier sustainability into your policy ensures that your diversity equity and inclusion efforts are holistic and defensible.
Index Construction for SMEs: Practical Realities
We know you don’t have a 50-person HR department. The total number of data points doesn’t have to be massive. A minimum dataset includes headcount by level, basic pay bands, and one annual inclusion-survey cycle.
“For SMEs, the goal of an index isn’t perfection; it’s transparency. Showing a gap and a plan to close it is more valuable to an investor than a perfect score with no substance.” — ESG Reporting Specialist
Upstream Pressure: Why “De-Risking” Starts with Your Data
The global shift toward supply chain transparency has created a “trickle-down” effect of accountability. Large-cap companies are no longer just looking at their direct employees; they are being audited on their entire value chain. If a major manufacturer discovers a lack of diversity equity and inclusion in their mid-tier providers, it flags a vendor risk that could impact their own ESG rating.
The SME as a “Safe Harbor”
By proactively regularly assessing your performance via an inclusion index, you position your business as a “safe harbor” for upstream buyers. When a procurement officer reviews a supplier sustainability questionnaire, a firm that provides a measurable score for inclusive growth and people development will always outshine a competitor offering vague platitudes.
Contractual KPIs and Tender Wins
We are seeing a rapid increase in contractual KPIs tied to social metrics. It is no longer rare to see “Diversity Thresholds” as a prerequisite for bidding. Leveraging an index allows you to:
Identify gaps before a buyer’s audit finds them.
Provide evidence of unconscious bias training and inclusive hiring practices.
Demonstrate a diverse workforce that mirrors the end-consumer market, reducing reputational risk for the lead firm.
Appendix: Glossary of Equity and Inclusion (DEI)
To assist organizations in navigating the technical language of DEIB efforts, use the following definitions for internal policy and report alignment:
Adverse Impact: This occurs when employment practices—such as recruitment, advancement, or hiring—yield significantly disproportionate results that negatively affect specific protected groups based on race, gender, or ethnicity.
Adjusted Pay Gap: A calculated metric that identifies compensation disparities between demographic cohorts by isolating and controlling for objective variables like professional experience, job function, and geographic cost-of-living.
eNPS (Employee Net Promoter Score): A strategic quantitative tool designed to gauge organizational health by measuring how likely staff members are to recommend their company as a place of work, serving as a proxy for engagement and cultural sentiment.
- Inclusion Index: A composite score that combines quantitative representation data with qualitative employee sentiment.
Intersectionality: The interconnected nature of social categorizations such as race, class, and gender, creating overlapping and interdependent systems of discrimination or disadvantage.
Promotion Parity Ratio: A comparison of the rate at which underrepresented groups are promoted compared to the company average.
Supplier Diversity: A proactive business program which encourages the use of minority-owned, women-owned, and veteran-owned businesses as suppliers.
Time-Series Reporting: The practice of presenting data over several years to track progress and filter out short-term volatility.
Unconscious Bias: Social stereotypes about certain groups of people that individuals form outside their own conscious awareness.
Value Chain: The full range of activities—including supply chain, internal operations, and distribution—that a company conducts to bring a product from conception to use.
SME Inclusion & Sentiment Survey Template
Instructions for Employees: This survey is anonymous. Your honest feedback helps us identify gaps and build a more inclusive workplace. Results are aggregated to ensure no individual can be identified.
Section 1: Demographics (Optional but Recommended)
To help us understand if different groups have different experiences, please select the categories you identify with:
Gender Identity: [Male / Female / Non-binary / Prefer not to say]
Ethnicity/Race: [List relevant regional categories]
Disability Status: [Yes / No / Prefer not to say]
Veteran Status: [Yes / No]
Work Level: [Entry / Mid-level / Management / Leadership]
Section 2: The Inclusion Index (Likert Scale 1-5)
(1: Strongly Disagree, 5: Strongly Agree)
Pillar: Belonging & Culture
I feel like I can be my authentic self at work.
My manager fosters an inclusive environment where diverse perspectives are valued.
I feel like a valued member of my team.
Pillar: Fairness & Equity
4. People from underrepresented groups have the same opportunities for success here as anyone else.
5. The process for career advancement and people development is transparent and fair.
6. I believe I am compensated fairly for my work relative to my peers.
Pillar: Safety & Voice
7. I feel comfortable voicing a contrary opinion without fear of negative consequences.
8. If I witnessed unconscious bias or harassment, I am confident the company would address it effectively.
Section 3: Open-Ended Feedback
What is one thing we could do to make our workplace more inclusive?
Have you observed any barriers to diverse talent thriving in our organization?
How to Calculate Your “Inclusion Score”
To turn these answers into a metric for your ESG reporting or supplier questionnaires, and to feed into a broader ESG report preparation process, use this simple formula:
$$Inclusion Index Score = left( frac{text{Sum of all Likert responses}}{text{Total number of questions} times 5} right) times 100$$
80–100%: High Inclusion (Leader)
60–79%: Moderate Inclusion (Developing)
Below 60%: High Risk (Immediate Intervention Required)
Next Steps for Your Data
Identify Gaps: Use the demographic data to see if different groups (e.g., women vs. men) have significantly different scores.
Benchmarking: Record this as your “Year 0” baseline to track progress for your next investor or audit review.
FAQs
What is a Diversity and Inclusion Index?
It is a tool used to measure an organization’s commitment to diversity through a mix of demographic data and employee sentiment metrics, forming a critical part of broader ESG and corporate sustainability practices.
How do you measure inclusion in the workplace?
By leveraging surveys that assess a sense of belonging, equity in people development, and the transparency of leadership decisions.
Why is an inclusion index important for SMEs?
It provides actionable insights for investors and buyers, helping SMEs qualify for contracts that require strict ESG and supplier sustainability proof by demonstrating the business value of a robust ESG strategy and performance.
What are common inclusion metrics?
Key metrics include representation by gender and ethnicity, pay equity ratios, and promotion rates for underrepresented groups.
How can I identify gaps in my DEI efforts?
By regularly assessing your workforce data against industry benchmarks to see where diverse talent stalls in the pipeline.
Does diversity improve company performance?
Yes. Research consistently shows that diverse workforce teams lead to better innovation, higher performance, and improved relative performance in the market.
What is the role of leadership in DEIB?
Leadership must set measurable goals, model inclusive behavior, and ensure accountability through transparent report cycles.
How do I handle data privacy with DEI metrics?
Always use anonymized surveys and follow strict data governance to protect employees while meeting audit expectations and broader ESG audit requirements.
What is supplier diversity?
It is the practice of leveraging a supply chain that includes businesses owned by underrepresented groups.
How does the CSRD affect SME reporting?
The CSRD requires more attention to social disclosures, meaning SMEs in the value chain of large EU firms must provide verified inclusion data, often validated through structured ESG audit processes.
About ESG The Report
ESG The Report is your trusted source for straightforward, up-to-date insights on environmental, social, and governance reporting. We focus on sustainable strategies, ethical supply chains, and ESG reporting solutions that help businesses and investors make better decisions. Through expert commentary and practical research, we show how ESG practices lead to real-world results. We specialize in helping firms navigate vendor risk, supplier sustainability, and complex ESG questionnaires, ensuring your value chain is a source of strength, not a liability.

Dean Emerick is a curator on sustainability issues with ESG The Report, an online resource for SMEs and Investment professionals focusing on ESG principles. Their primary goal is to help middle-market companies automate Impact Reporting with ESG Software. Leveraging the power of AI, machine learning, and AWS to transition to a sustainable business model. Serving clients in the United States, Canada, UK, Europe, and the global community. If you want to get started, don’t forget to Get the Checklist! ✅