
Climate change affects us all, and understanding each country’s role is crucial. You might be surprised to find out how the United States is contributing to climate change and how much we need to do to reduce our impact. Let’s explore America’s carbon footprint and what it means for our planet’s future.
In this article, you will learn:
- The United States’ Significant Role in Global Emissions: Discover how US greenhouse gas emissions contribute to global warming and its position among the top emitters worldwide.
- Major Sectors Driving America’s Carbon Footprint: Explore which sectors, such as energy and transportation, are the largest contributors to the United States’ greenhouse gas emissions.
- Effective Strategies to Reduce US Contributions: Understand the measures needed, including transitioning to renewable energy and improving energy efficiency, to lower the United States’ impact on climate change.
Understanding the United States’ Greenhouse Gas Emissions
The United States is one of the largest contributors to global greenhouse gas emissions. US emissions have been significant since the industrial revolution began, marking the start of a dramatic rise in greenhouse emissions worldwide. Each year, the US releases a significant amount of CO2 and greenhouse emissions into the atmosphere. These emissions come from various sources, including transportation, industry, and burning fossil fuels in energy production.
In recent years, US greenhouse gas emissions by year have fluctuated due to changes in energy policies and economic activities, with annual emissions often measured in the hundreds of million metric tons. Despite efforts to reduce emissions, the United States continues to be a major player in global warming. Understanding the trends in US GHG emissions is essential for creating effective climate strategies.
Sources of GHG Emissions Estimates
Understanding the sources of greenhouse gas emissions estimates is crucial for tracking progress and shaping effective climate policies. The U.S. Environmental Protection Agency (EPA) plays a pivotal role in this process. Each year, the EPA publishes comprehensive estimates of total U.S. greenhouse gas emissions to fulfill the country’s commitments under the United Nations Framework Convention on Climate Change (UNFCCC). These estimates provide a detailed overview of the greenhouse gases emitted across various sectors.
Complementing the EPA’s efforts, the U.S. Energy Information Administration (EIA) offers detailed estimates of energy-related carbon dioxide (CO2) emissions. The EIA breaks down these emissions by fuel source and by fuel-consuming sector, providing monthly and yearly data. This granular approach helps in understanding the specific contributions of different fuels and sectors to the overall emissions.
Authoritative sources such as the Intergovernmental Panel on Climate Change (IPCC) and its assessment reports are also key references for global emissions data and methodologies. These offer scientific analyses and policy recommendations that guide national and international climate action.
The EIA’s estimates are derived from a wide array of data sources, including energy producers, consumers, and various government agencies. Together, the EPA and EIA estimates are instrumental in tracking the United States’ progress in reducing greenhouse gas emissions. They also play a critical role in informing policy decisions and evaluating the effectiveness of climate change mitigation strategies. In these reports, global warming potentials are used to compare the impact of different greenhouse gases by expressing their emissions in terms of CO2 equivalents.
America’s Carbon Footprint: Key Contributors
America’s carbon footprint is shaped by several economic sectors. The energy sector is the largest contributor, accounting for a significant portion of US greenhouse gas emissions. Transportation follows closely, with vehicles emitting large amounts of CO2 each year.
Industry and agriculture also play crucial roles in America’s carbon footprint. Cement production, a major industrial process, is a significant source of CO2 emissions due to the release of carbon dioxide during clinker manufacturing, and it contributes notably to total greenhouse gas emissions. These economic sectors contribute to the United States’ total greenhouse gas emissions, highlighting the need for targeted solutions to reduce emissions across all areas.
US Greenhouse Gas Emissions by Sector
Breaking down US greenhouse gas annual emissions by sector provides a clearer picture of where reductions are needed. A significant decline in electric power sector emissions has been observed, attributed to a transition from coal to natural gas, a rise in renewable energy use, and stabilizing electricity demand. The energy sector leads the way, primarily through the burning of fossil fuels for electricity generation and heat. Transportation is the second-largest sector, with cars, trucks, and airplanes contributing heavily to emissions.
Industry accounts for a significant share of US GHG emissions, especially in manufacturing and construction. Agriculture, though smaller in comparison, still contributes to the United States’ greenhouse gas emissions through livestock, land use change, and related activities. Land use, land-use change, and forestry (LULUCF) also play a crucial role in emissions, as deforestation and changes in land management can release stored carbon and impact the overall carbon budget. Methane emissions from agriculture and waste sectors, particularly from livestock and landfills, are significant due to methane’s high global warming potential. Addressing emissions in each sector is vital for reducing the overall carbon footprint.
Historical Perspective: US GHG Emissions Over the Years
Looking at US greenhouse gas emissions by year reveals important trends. Since the industrial revolution in the mid-eighteenth century, the United States has been a major source of significant increases in both US and global carbon emissions. Historically, the United States has been one of the top emitters globally. Over the past few decades, efforts to reduce carbon emissions have seen some success, but the overall impact remains substantial.
CO2 emissions by year USA data show that emissions peaked in the late 20th century and have seen some decline recently. However, the United States still contributes a large share of global carbon emissions, making it a key player in the fight against climate change. The historical carbon emissions from the US have significantly affected the global carbon budget, reducing the remaining carbon budget available to limit warming to targets such as 1.5°C or 2°C.
The United States’ Contribution to Global Warming
So, how much does the US contribute to global warming? The United States accounts for approximately 15% of global greenhouse gas emissions. This significant percentage highlights the country’s responsibility in addressing climate change. US emissions play a major role in driving increases in average global temperatures and global temperatures, which are closely linked to the severity of climate change impacts.
The US’s contribution to climate change is not just about the total emissions but also about the high per capita emissions, which are among the highest in the world compared to other nations. Reducing the United States’ greenhouse gas emissions is crucial for meeting global climate goals and limiting the impacts of global warming.
Reducing future emissions is essential to stay within the remaining carbon budget and to meet international climate targets aimed at limiting global temperature rise.
The US Biggest Polluter: Understanding the Impact
The United States is often labeled as one of the biggest polluters globally. This title stems from the country’s high levels of greenhouse gas emissions, largely due to fossil fuel combustion, which was responsible for 74% of total U.S. GHG emissions and 92% of U.S. anthropogenic CO2 emissions in 2019. Fossil fuel burning and the amount of fossil fuels burned in various economic sectors are the primary sources of US emissions. As the US economy is heavily reliant on fossil fuel use, reducing emissions presents both challenges and opportunities.
Addressing the role of the US as a major polluter involves transitioning to cleaner energy sources, improving energy efficiency, and implementing policies that encourage sustainable practices. By taking these steps, the United States can significantly reduce its environmental impact.
How Much Pollution Does America Produce?
America produces a vast amount of pollution each year, contributing to both local and global environmental issues. The United States emits millions of tons of CO2 annually, along with other harmful pollutants like methane and nitrous oxide. Pollution from these greenhouse gas emissions is a major driver of climate disasters, such as more frequent and severe storms, wildfires, and floods, which cause significant economic and social damage. In addition to greenhouse gases, other factors—such as aerosols and ozone-depleting substances—also impact climate change but are not always included in standard greenhouse gas inventories. The Regional Greenhouse Gas Initiative (RGGI) is a critical state-level policy aimed at capping and reducing CO2 emissions from the power sector.
This pollution affects not only the climate but also public health and ecosystems. Reducing pollution requires comprehensive strategies that involve government action, corporate responsibility, and individual efforts to lower emissions and adopt sustainable lifestyles.
The Energy Connection
The connection between energy and greenhouse gas emissions lies in the chemistry of fossil fuels. Fossil fuels, such as coal, oil, and natural gas, are primarily composed of carbon and hydrogen. When these fuels are combusted, or burned, the carbon combines with oxygen to form carbon dioxide (CO2), and the hydrogen combines with oxygen to form water (H2O). This combustion process releases heat, which we harness for energy.
The amount of CO2 produced during combustion depends on the carbon content of the fuel. For instance, natural gas, which is predominantly methane (CH4), has a higher hydrogen content compared to other fossil fuels. This means that burning natural gas produces less CO2 for the same amount of heat generated compared to burning coal or oil. This characteristic makes natural gas a relatively cleaner fossil fuel option, although it still contributes to greenhouse gas emissions.
Understanding the energy connection is vital for developing strategies to reduce carbon dioxide emissions. By transitioning to fuels with lower carbon content and investing in renewable energy sources, we can significantly lower the greenhouse gases emitted from energy production. Carbon sequestration, which involves capturing and storing CO2 in long-term reservoirs such as plants, soil, and oceans, is also an important strategy for offsetting emissions from energy production.
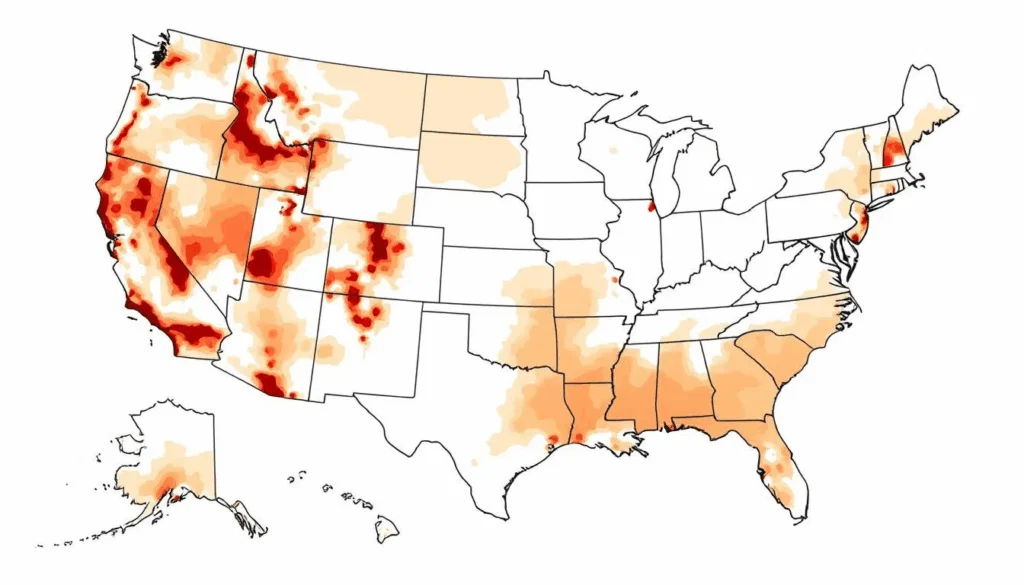
State-Level Emissions
Greenhouse gas emissions in the United States vary significantly from state to state. Factors such as population size, economic activity, and energy consumption patterns play a crucial role in determining state-level emissions. The top five emitting states—Texas, California, Florida, New York, and Illinois—together account for over 40% of total U.S. greenhouse gas emissions.
Texas, with its large industrial base and significant energy production, is the largest emitter of greenhouse gases in the country. California, despite its strong environmental policies, ranks second due to its large population and economic activity. Florida, New York, and Illinois follow, each contributing substantial emissions due to their size and industrial activities.
Some states have taken proactive measures to reduce their greenhouse gas emissions. For example, California and New York have implemented cap-and-trade programs and renewable portfolio standards to encourage the use of renewable energy and reduce reliance on fossil fuels. These state-level initiatives are crucial for achieving national and global climate goals.
Accurately tracking state-level emissions is essential because they are aggregated to determine national emissions, which reflect the United States’ overall contribution to climate change. Reliable national emissions accounting helps ensure that each state’s impact is properly represented in national and international climate assessments.
State-by-State Emissions
Breaking down the emissions data further, we see that Texas is the largest emitter of greenhouse gases in the United States, accounting for around 10% of total U.S. emissions. This is largely due to its extensive energy production and industrial activities. California follows as the second-largest emitter, contributing approximately 6% of the nation’s total emissions. Despite its environmental initiatives, California’s large population and economic activities result in significant emissions.
Florida ranks third, with around 5% of total U.S. emissions, driven by its growing population and energy consumption. New York, with its dense population and economic activities, is the fourth-largest emitter, accounting for about 4% of the total emissions. Illinois rounds out the top five, contributing around 3% of the nation’s greenhouse gases.
These figures highlight the importance of targeted state-level policies and initiatives to reduce greenhouse gas emissions. By focusing on the largest emitters and implementing effective strategies, the United States can make significant progress in its efforts to combat climate change.
Effects of Climate Change in the United States
Climate change is leaving a profound mark on the United States, with impacts that are both widespread and deeply felt across the nation. Since 1970, the country has warmed by 2.6 °F (1.4 °C), and the global average temperature has soared to 1.45 °C above pre-industrial levels—making recent years the hottest on record. This rise in temperature is driving more frequent and severe natural disasters, including hurricanes, wildfires, floods, and droughts, as well as shifts in regional climate patterns and the spread of invasive species.
At the heart of these changes are rising greenhouse gas emissions, particularly carbon dioxide released from burning fossil fuels like coal, oil, and natural gas. The United States remains one of the world’s largest emitters of greenhouse gases, with over 5 billion metric tons of carbon dioxide emitted in 2020 alone. These emissions not only contribute to global warming but also intensify the frequency and severity of extreme weather events, threatening communities and ecosystems nationwide.
The effects of climate change ripple through every economic sector. In agriculture, shifting precipitation patterns and rising temperatures are reducing crop yields and threatening food security. The economic sector faces mounting costs from climate-related disasters, which disrupt industries such as insurance, tourism, and recreation. Human health is also at risk, with heatwaves, air pollution, and the spread of vector-borne diseases becoming more common. Even national security is impacted, as climate changes can exacerbate resource scarcity and drive migration.
To address these challenges, the United States is taking steps to reduce greenhouse gas emissions and transition to renewable energy sources. The Inflation Reduction Act, passed in 2022, aims to cut emissions by 40% by 2030 and accelerate the adoption of clean energy technologies like solar and wind power. Efforts to increase energy efficiency, promote sustainable land use, and protect natural carbon sinks—such as forests and wetlands—are also critical for sequestering carbon dioxide and shrinking the nation’s carbon footprint.
Despite these initiatives, the US still faces significant hurdles. Per capita emissions remain among the highest globally, and the country’s historical emissions have played a major role in the current climate crisis. Achieving meaningful progress will require robust policies that prioritize environmental protection, such as stricter fuel efficiency standards, support for electric vehicles, and encouragement of sustainable consumption habits.
The Environmental Protection Agency (EPA) is central to these efforts, working to regulate greenhouse gas emissions and promote climate change mitigation across sectors like power generation, transportation, and industry. The agency also supports climate-resilient infrastructure and communities, helping the nation adapt to the realities of a warming world.
In summary, climate change poses urgent and far-reaching challenges for the United States, affecting the environment, economy, and public health. Reducing greenhouse gas emissions, expanding renewable energy, and protecting natural carbon sinks are essential steps toward climate change mitigation. By prioritizing sustainability and environmental protection, the US can help secure a safer, more resilient future for generations to come.
Reducing the US Contribution to Greenhouse Gases
To mitigate the United States’ contribution to greenhouse gases, several measures can be taken. Transitioning to renewable energy sources like wind, solar, and hydroelectric power is essential. Investing in energy efficiency can also significantly lower emissions from buildings and industries.
Promoting electric vehicles and improving public transportation can reduce emissions from the transportation sector. Additionally, policies that support sustainable agriculture and forestry practices can help sequester carbon and further decrease the United States’ greenhouse gas emissions.
Addressing land use change and forestry, including the land use, land-use change, and forestry (LULUCF) sector, is essential for reducing emissions and enhancing carbon sequestration, as these activities play a significant role in the overall carbon budget and climate change mitigation.
Policy and Innovation: Combating Climate Change in the US
Policy and innovation play critical roles in reducing US greenhouse gas emissions. Government initiatives aimed at limiting emissions, such as carbon pricing and emissions trading systems, can drive significant changes in how energy is produced and consumed. The European Union’s climate policies are often cited as a benchmark for US policy innovation, providing valuable examples of effective strategies.
Innovation in technology also offers solutions to climate change. Advances in renewable energy, energy storage, and carbon capture and storage (CCS) can help lower the United States’ carbon footprint. Encouraging research and development in these areas is key to achieving long-term sustainability. Carbon Brief is a key source for emissions data and analysis, offering comprehensive and transparent insights into global and national emission responsibilities.
Comparing US Emissions to Other Countries
When comparing US greenhouse gas emissions to other countries, the United States remains one of the top emitters. While countries like China and India have higher total emissions, the US has one of the highest per capita emissions rates. Developing countries, however, are disproportionately affected by global climate change due to their limited resources and greater vulnerability, despite contributing less to overall emissions.
This comparison underscores the importance of the United States taking a leading role in global climate efforts and cooperating with other countries to address global climate change. By reducing its emissions and promoting sustainable practices, the US can set an example for other nations and contribute significantly to global climate goals.
The U.S. vs Europe
When comparing the United States and Europe on climate change, the differences are stark. The European Union has built a comprehensive policy framework that integrates emissions reductions into nearly every sector, while the U.S. has historically relied on a patchwork of federal and state policies. For SMEs that trade across the Atlantic, these differences create both challenges and opportunities.
EU Emissions Profile and Carbon Pricing
The EU has steadily reduced greenhouse gas emissions over the past three decades. Since 1990, total EU emissions have dropped by more than 30%, even as the economy expanded. A key driver has been the Emissions Trading System (EU ETS), the world’s largest carbon market. This system puts a price on carbon by capping emissions and allowing companies to trade allowances. The ETS currently covers power plants, industry, and aviation, with shipping being phased in. By contrast, the U.S. has no federal carbon pricing mechanism, though states such as California operate their own markets. For SMEs, this means that exporting to Europe requires understanding embedded carbon costs, while operating domestically may not yet incur such charges.
Renewables and Energy Transition
Europe’s energy mix has transformed in recent years. Wind and solar power now make up more than 40% of the EU’s electricity generation. The European Green Deal aims to make the bloc climate neutral by 2050, with aggressive targets for renewables, efficiency, and electrification. In the U.S., renewables are growing but still compete heavily with natural gas and oil. While federal incentives such as the Inflation Reduction Act have accelerated investment, the pace of transition lags behind Europe. SMEs sourcing energy in Europe are likely to face lower-carbon electricity, while U.S.-based firms may need to make deliberate choices to secure renewable contracts.
Regulatory Strictness and Per Capita Emissions
European regulations are stricter and more comprehensive than those in the U.S. Standards cover vehicle emissions, building efficiency, and corporate disclosures. The new Corporate Sustainability Reporting Directive (CSRD) requires thousands of companies, including some non-EU firms, to report detailed ESG data. Per capita, the EU’s carbon emissions are significantly lower than those of the U.S. This discrepancy highlights not only differences in policy but also in consumer behavior and infrastructure.
Lessons for SMEs in Transatlantic Trade
For SMEs exporting to Europe, the EU Carbon Border Adjustment Mechanism (CBAM) is a critical development. Beginning in 2026, companies will need to report and pay for the carbon content of goods such as steel, aluminum, and cement. U.S. SMEs in these sectors should begin collecting emissions data now to remain competitive. Even outside carbon-intensive industries, American SMEs should expect European partners to request emissions disclosures as part of procurement.
In short, Europe has institutionalized climate policy, while the U.S. remains fragmented. For SMEs, the lesson is clear: adopt European-style reporting and emissions tracking now. Doing so not only prepares you for trade compliance but also improves credibility with investors and customers at home.
The U.S. vs India
Comparing the United States and India on emissions reveals the sharp contrasts between industrialized and developing economies. Both countries play vital roles in global climate policy, but their positions and priorities diverge due to history, wealth, and development needs. For SMEs, this comparison underscores the complexities of global supply chains and investor expectations.
Emissions Intensity vs Population Size
India is the world’s third-largest emitter in absolute terms, but its per capita emissions are far below those of the U.S. In 2023, the average American emitted more than seven times the carbon dioxide of the average Indian. This difference stems from high U.S. energy consumption, sprawling infrastructure, and dependence on fossil fuels, compared with India’s lower average living standards. For SMEs, the message is that relying solely on “total emissions” as a benchmark can mislead. Investors and regulators increasingly look at per capita and historical responsibility.
Development Needs vs Climate Commitments
India faces a dual challenge: lifting millions out of poverty while cutting emissions. The country relies heavily on coal for electricity, though it is also leading in renewable energy growth. India has pledged to reach net-zero by 2070, a later target than the U.S. and EU. The U.S., by contrast, is committed to net-zero by 2050. SMEs sourcing from India must recognize that Indian suppliers may face less stringent domestic climate rules but are still under pressure from international buyers.
Outsourcing and Supply Chain Risks
Many U.S. and European companies outsource manufacturing to India due to cost advantages. This creates risks if emissions data are missing or inconsistent. As global buyers demand Scope 3 emissions reporting, Indian SMEs will need to provide reliable data. U.S. SMEs dependent on Indian suppliers must be proactive. Work with suppliers to improve energy efficiency, provide training on emissions reporting, and encourage the adoption of renewables. Failure to do so could result in exclusion from European or U.S. value chains where disclosure is mandatory.
Lessons for SMEs
The key takeaway is that India’s emissions story is shaped by development. U.S. SMEs cannot apply the same expectations but must still manage compliance across borders. Supporting suppliers with tools and training can strengthen relationships and ensure resilience against future regulation.
The U.S. vs Russia
Russia and the U.S. share some similarities in their emissions profiles, particularly in their dependence on fossil fuels. However, the global political context makes Russia a unique case. For SMEs, the risks of exposure to Russian supply chains are more geopolitical than regulatory.
Energy Mix Dominated by Oil and Gas
Russia’s economy is heavily reliant on oil and natural gas exports. Fossil fuels dominate both its domestic energy mix and export revenues. Unlike the U.S., which has a more diversified economy and a growing renewable sector, Russia has made limited progress in reducing its reliance on hydrocarbons. This creates a high emissions intensity per unit of GDP.
Global Political Implications
The 2022 invasion of Ukraine triggered sweeping sanctions and dramatically reshaped global energy markets. Europe reduced its dependence on Russian gas, while Russia pivoted exports toward Asia. For SMEs, this means that sourcing from Russian suppliers carries reputational, legal, and operational risks. Investors and regulators increasingly scrutinize supply chains for links to sanctioned entities.
Emissions vs Exports
While Russia is a top-five global emitter, much of its climate footprint is tied to fossil fuel production and export. When Russian oil or gas is burned abroad, those emissions are counted in the importing country’s ledger. This complicates accounting but does not diminish Russia’s central role in global climate change. U.S. SMEs competing with Russian exporters, particularly in Europe, should anticipate advantages from CBAM and other carbon-based trade measures, as Russian products often have high embedded emissions.
Lessons for SMEs
The primary lesson is to avoid exposure to Russian supply chains unless absolutely necessary. Seek alternatives in markets with stronger governance and more transparent emissions data. For exporters, emphasize low-carbon credentials when competing with Russian-origin goods in Europe or Asia.
The U.S. vs China
No climate comparison is more consequential than that between the U.S. and China. Together, they account for nearly 40% of global carbon dioxide emissions. For SMEs, this rivalry shapes supply chain realities, trade policy, and investment flows.
Largest Total Emitter vs Per Capita Dominance
China is the largest emitter in absolute terms, contributing about 30% of annual global CO₂. However, the U.S. still leads on per capita emissions, with each American producing more than twice the emissions of the average Chinese citizen. This distinction matters because global negotiations often focus on equity — who should bear the cost of reductions.
Coal Reliance vs Renewable Expansion
China relies on coal for more than half its electricity, but it is also the world’s largest investor in renewable energy. In 2023 alone, China added more solar capacity than the rest of the world combined. The U.S. is catching up with incentives, but the scale of Chinese deployment is unmatched. For SMEs, this means that supply chains tied to Chinese manufacturing increasingly involve both coal-heavy inputs and rapidly greening production.
Supply Chain Realities for SMEs
Most SMEs rely on Chinese suppliers for electronics, textiles, and intermediate goods. As global rules demand Scope 3 emissions data, Chinese suppliers’ carbon intensity will become more visible. Already, European buyers are asking for lifecycle assessments from Chinese manufacturers. U.S. SMEs must either push suppliers to improve transparency or risk losing contracts. Diversification is another strategy: shifting some sourcing to other Asian countries or nearshoring production can reduce exposure.
Lessons for SMEs
China represents both risk and opportunity. Its dominance in clean energy technology means SMEs can access affordable renewable equipment. At the same time, reliance on coal-heavy suppliers can hurt compliance and reputation. The key is active supplier management: audit emissions data, negotiate for cleaner inputs, and diversify where feasible.
The Future of US Greenhouse Gas Emissions
Looking ahead, the future of US greenhouse gas emissions depends on the actions taken today. Continued investment in renewable energy, stricter emissions regulations, and increased public awareness are crucial for reducing the United States’ carbon footprint.
To avoid further warming and stay within international climate targets, it is essential to limit future emissions. Managing these future emissions is critical because the remaining carbon budget—the amount of CO2 that can still be emitted while keeping global temperature rise below 1.5°C or 2°C—is rapidly shrinking.
The transition to a low-carbon economy presents both challenges and opportunities. By embracing sustainable practices and innovative technologies, the United States can significantly lower its greenhouse gas emissions and contribute to a healthier planet.
FAQ
What is a Personal ESG Score?
A Personal ESG Score measures an individual’s commitment to Environmental, Social, and Governance (ESG) principles. It evaluates actions and behaviors that impact sustainability and ethical standards.
How is a Personal ESG Score Calculated?
A Personal ESG Score is calculated based on factors like energy use, waste management, social responsibility, and ethical decision-making. It assesses how your lifestyle aligns with ESG criteria.
Why is a Personal ESG Score Important?
A Personal ESG Score highlights your contribution to sustainability and ethical practices. It encourages individuals to adopt behaviors that support environmental and social well-being.
How Can I Improve My Personal ESG Score?
You can improve your Personal ESG Score by reducing energy consumption, recycling, supporting ethical companies, and engaging in community service. Small changes can make a big difference.
Where Can I Check My Personal ESG Score?
Various platforms and apps offer Personal ESG Score assessments. These tools analyze your habits and provide a score based on your alignment with ESG principles.
Conclusion
The United States plays a significant role in climate change through its substantial greenhouse gas emissions. Understanding America’s carbon footprint and the sectors that contribute most to emissions is essential for creating effective strategies to reduce our impact. By embracing renewable energy, improving energy efficiency, and adopting sustainable practices, the US can lead the way in combating global warming. Together, we can work towards a healthier, more sustainable future for all.
About ESG The Report
ESG The Report delivers clear, current guidance on environmental, social, and governance practices for real businesses. We focus on practical strategies, ethical supply chains, affordable ESG reporting solutions, and impact measurement that leaders can use now. With expert commentary and hands‑on research, we show how ESG drives results for companies and communities. Openness, accountability, and innovation guide our work. Our easy‑to‑read articles cover climate change, software‑free ESG reporting, resource efficiency, and people‑first inclusion. We help you turn ESG challenges into long‑term advantages. Join our community for concise, actionable insights that support responsible growth.

Dean Emerick is a curator on sustainability issues with ESG The Report, an online resource for SMEs and Investment professionals focusing on ESG principles. Their primary goal is to help middle-market companies automate Impact Reporting with ESG Software. Leveraging the power of AI, machine learning, and AWS to transition to a sustainable business model. Serving clients in the United States, Canada, UK, Europe, and the global community. If you want to get started, don’t forget to Get the Checklist! ✅